About me
I love turning complex data into beautiful and insightful visuals that tell compelling stories. As a data visualization developer, I have over five years of experience in creating interactive dashboards, reports and charts. I use tools such as Power BI, Python and Advanced Excel to analyze, visualize and communicate data effectively. Being passionate about learning, I am now on the path of becoming a Data Scientist.
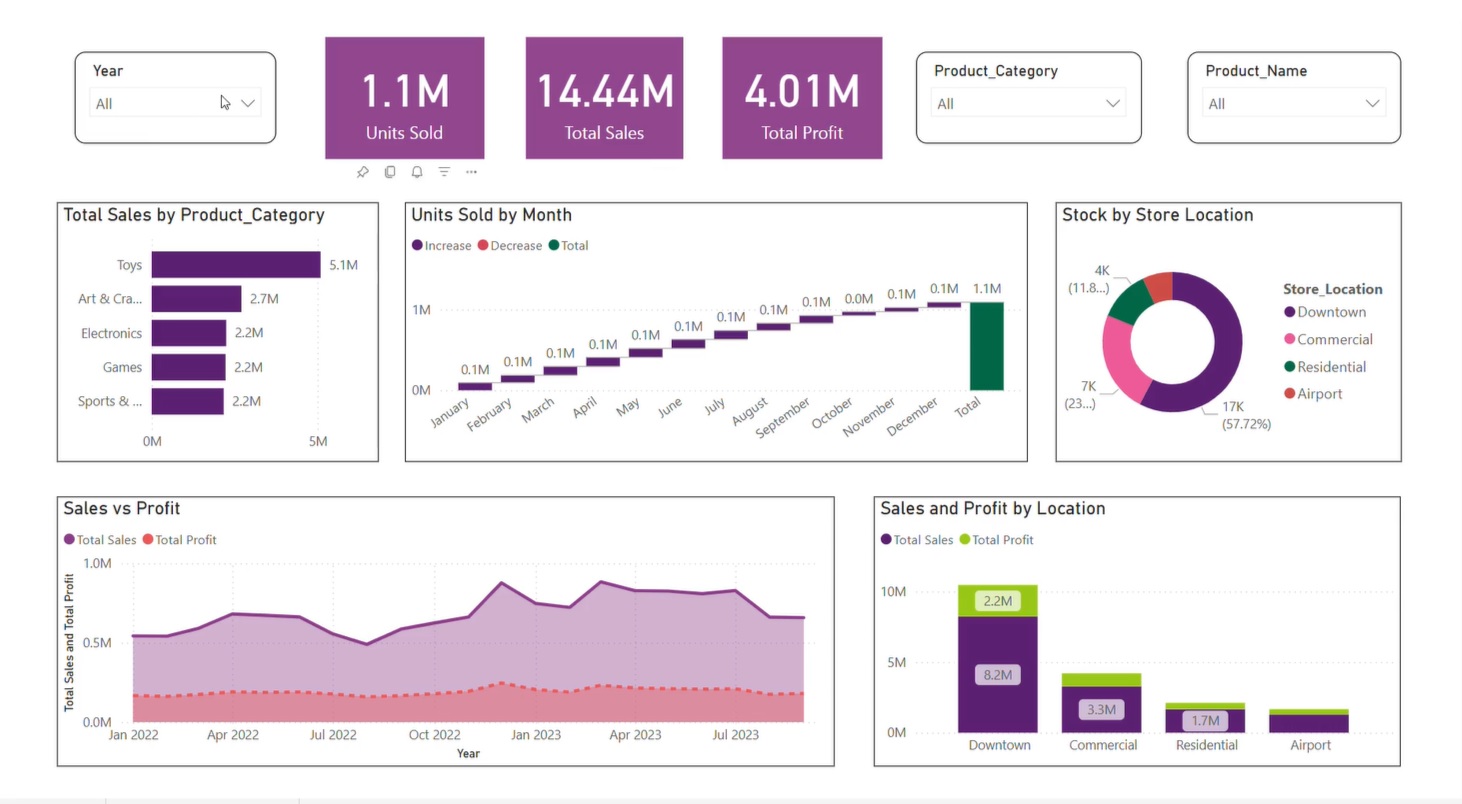
Currently working as a Corporate Data Analyst at an Event Services and Production firm. Leveraging Onedrive sharepoint as a centralized repository, I am working on creating dynamic PowerBI dashboards that transform raw data into actionable insights to take business decisions. Process involves meticulous data cleaning, wrangling, and transformation to ensure standardization and accuracy across reports. Power Automate is used to automate data collection for smooth tracking and maintaining quality of data.
Each dashboard is crafted with the end-user in mind, providing a seamless and intuitive experience that empowers decision-makers with real-time data.
My freelancing projects include:
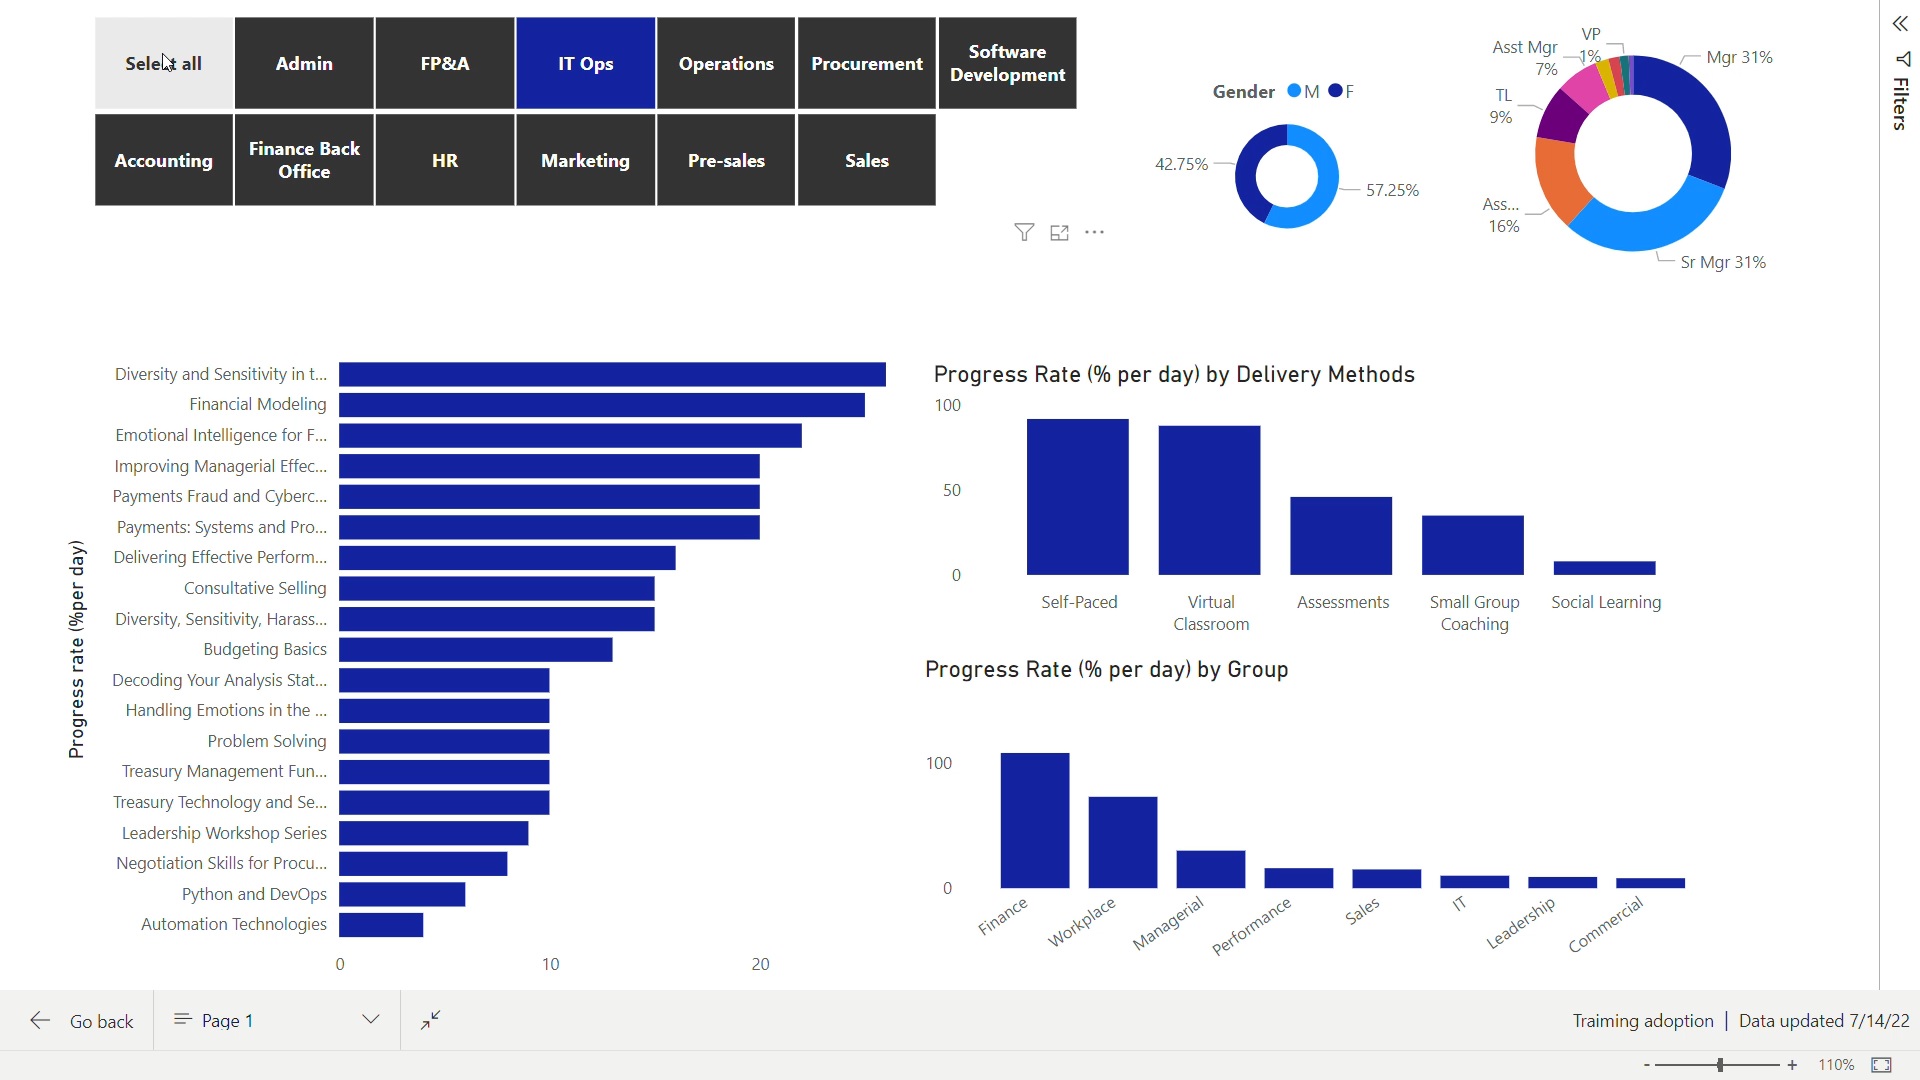
- Designing and developing interactive dashboards for a L&D client that showcased training sessions conducted over the past years, yearly, monthly and fiscal year volume comparison.
- Supported in customizing existing reporting format for client for effective report generation and data cleaning.
I am always eager to learn new skills and technologies to enhance my data visualization capabilities and also an AI enthusiast.
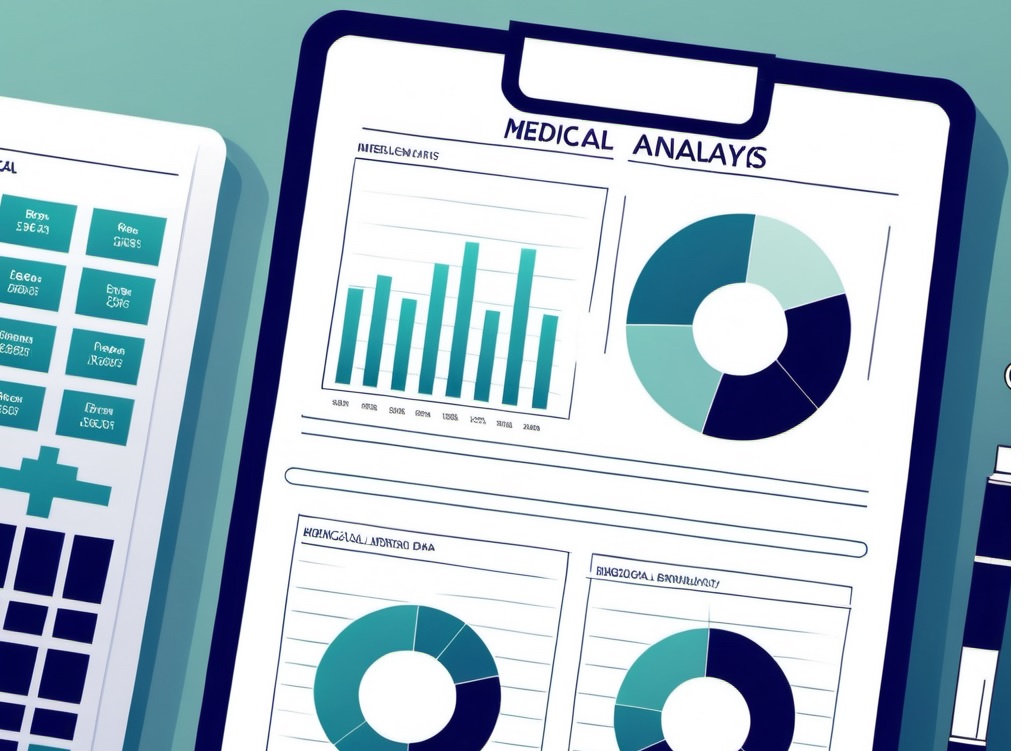
I am proficient in applying statistical methods and data-driven insights to solve business problems and support decision-making. I use Python libraries for indepth analysis and visualisation of data. Also skilled with MySQL and sqlite3 python. Have completed self projects in PowerBI, Data analysis using Python and sqlite3.
I am passionate about finding patterns and trends in data and communicating them effectively to stakeholders.
Projects
List of self projects completed